Design Generation
We synthesized research in a series of generative design sprints, culimating in two promising design concepts.
Overview
We spent months conducting extensive research on disaster mitigation, and interviewed subject matter experts and hurricane survivors in Puerto Rico. We created artifacts in the form of the user personas and journey maps to illustrate the experience of potential end users during and after a natural disaster. At this point, we began ideating solutions to the overall problem we had uncovered: communication.
We generated designs in a series of sprints to rapidly iterate solutions based on our research and artifacts from Puerto Rico. Towards the end of our design generation phase, we invited Eaton to co-create solutions using existing Eaton products and services.
Areas of Exploration
From our research, we identified a few technological concepts that are ripe for use as a design material in a disaster recovery context. These concepts became "areas of exploration" and served as a starting point for many generated designs.

Renewable Energy

Peer-to-Peer Networking

Information Gathering and Dispersal

Satellite Communication

Pre-Disaster Planning
Conceptual Design Sprints
Our design sprint system incorporated rapid design iteration, competitive analysis, and quick design turnover. The idea was to, at first, prioritize quantity over quality. The theory goes that by quickly generating many designs you generate a wide variety of ideas that you're not immediately attached to, allowing for more objective critique. From this, high quality-yet-unexpected ideas could emerge.
Below is our sequence of design exercises that we performed to generate and subsequently narrow our collection design sketches:
- Existing Feature Review and Lightning Demos: A five minute review from each team member of current products and services that could contribute to our solution.
- Crazy 8's: Rapid design brainstorming based on existing features and areas of exploration.
- Storyboarding: Creation of five storyboards based on the design brainstorms.
- Art Museum and Heat Mapping: We threw all of our storyboards up on the wall, and then labelled features or concepts that jumped out at us.
- Speed Critique: We each pitched our ideas, and picked each apart in turn. We finally voted on the top five designs, one for each area of exploration.
Top 5 Designs
After our conceptual design sequence, these 5 designs emerged as the best.
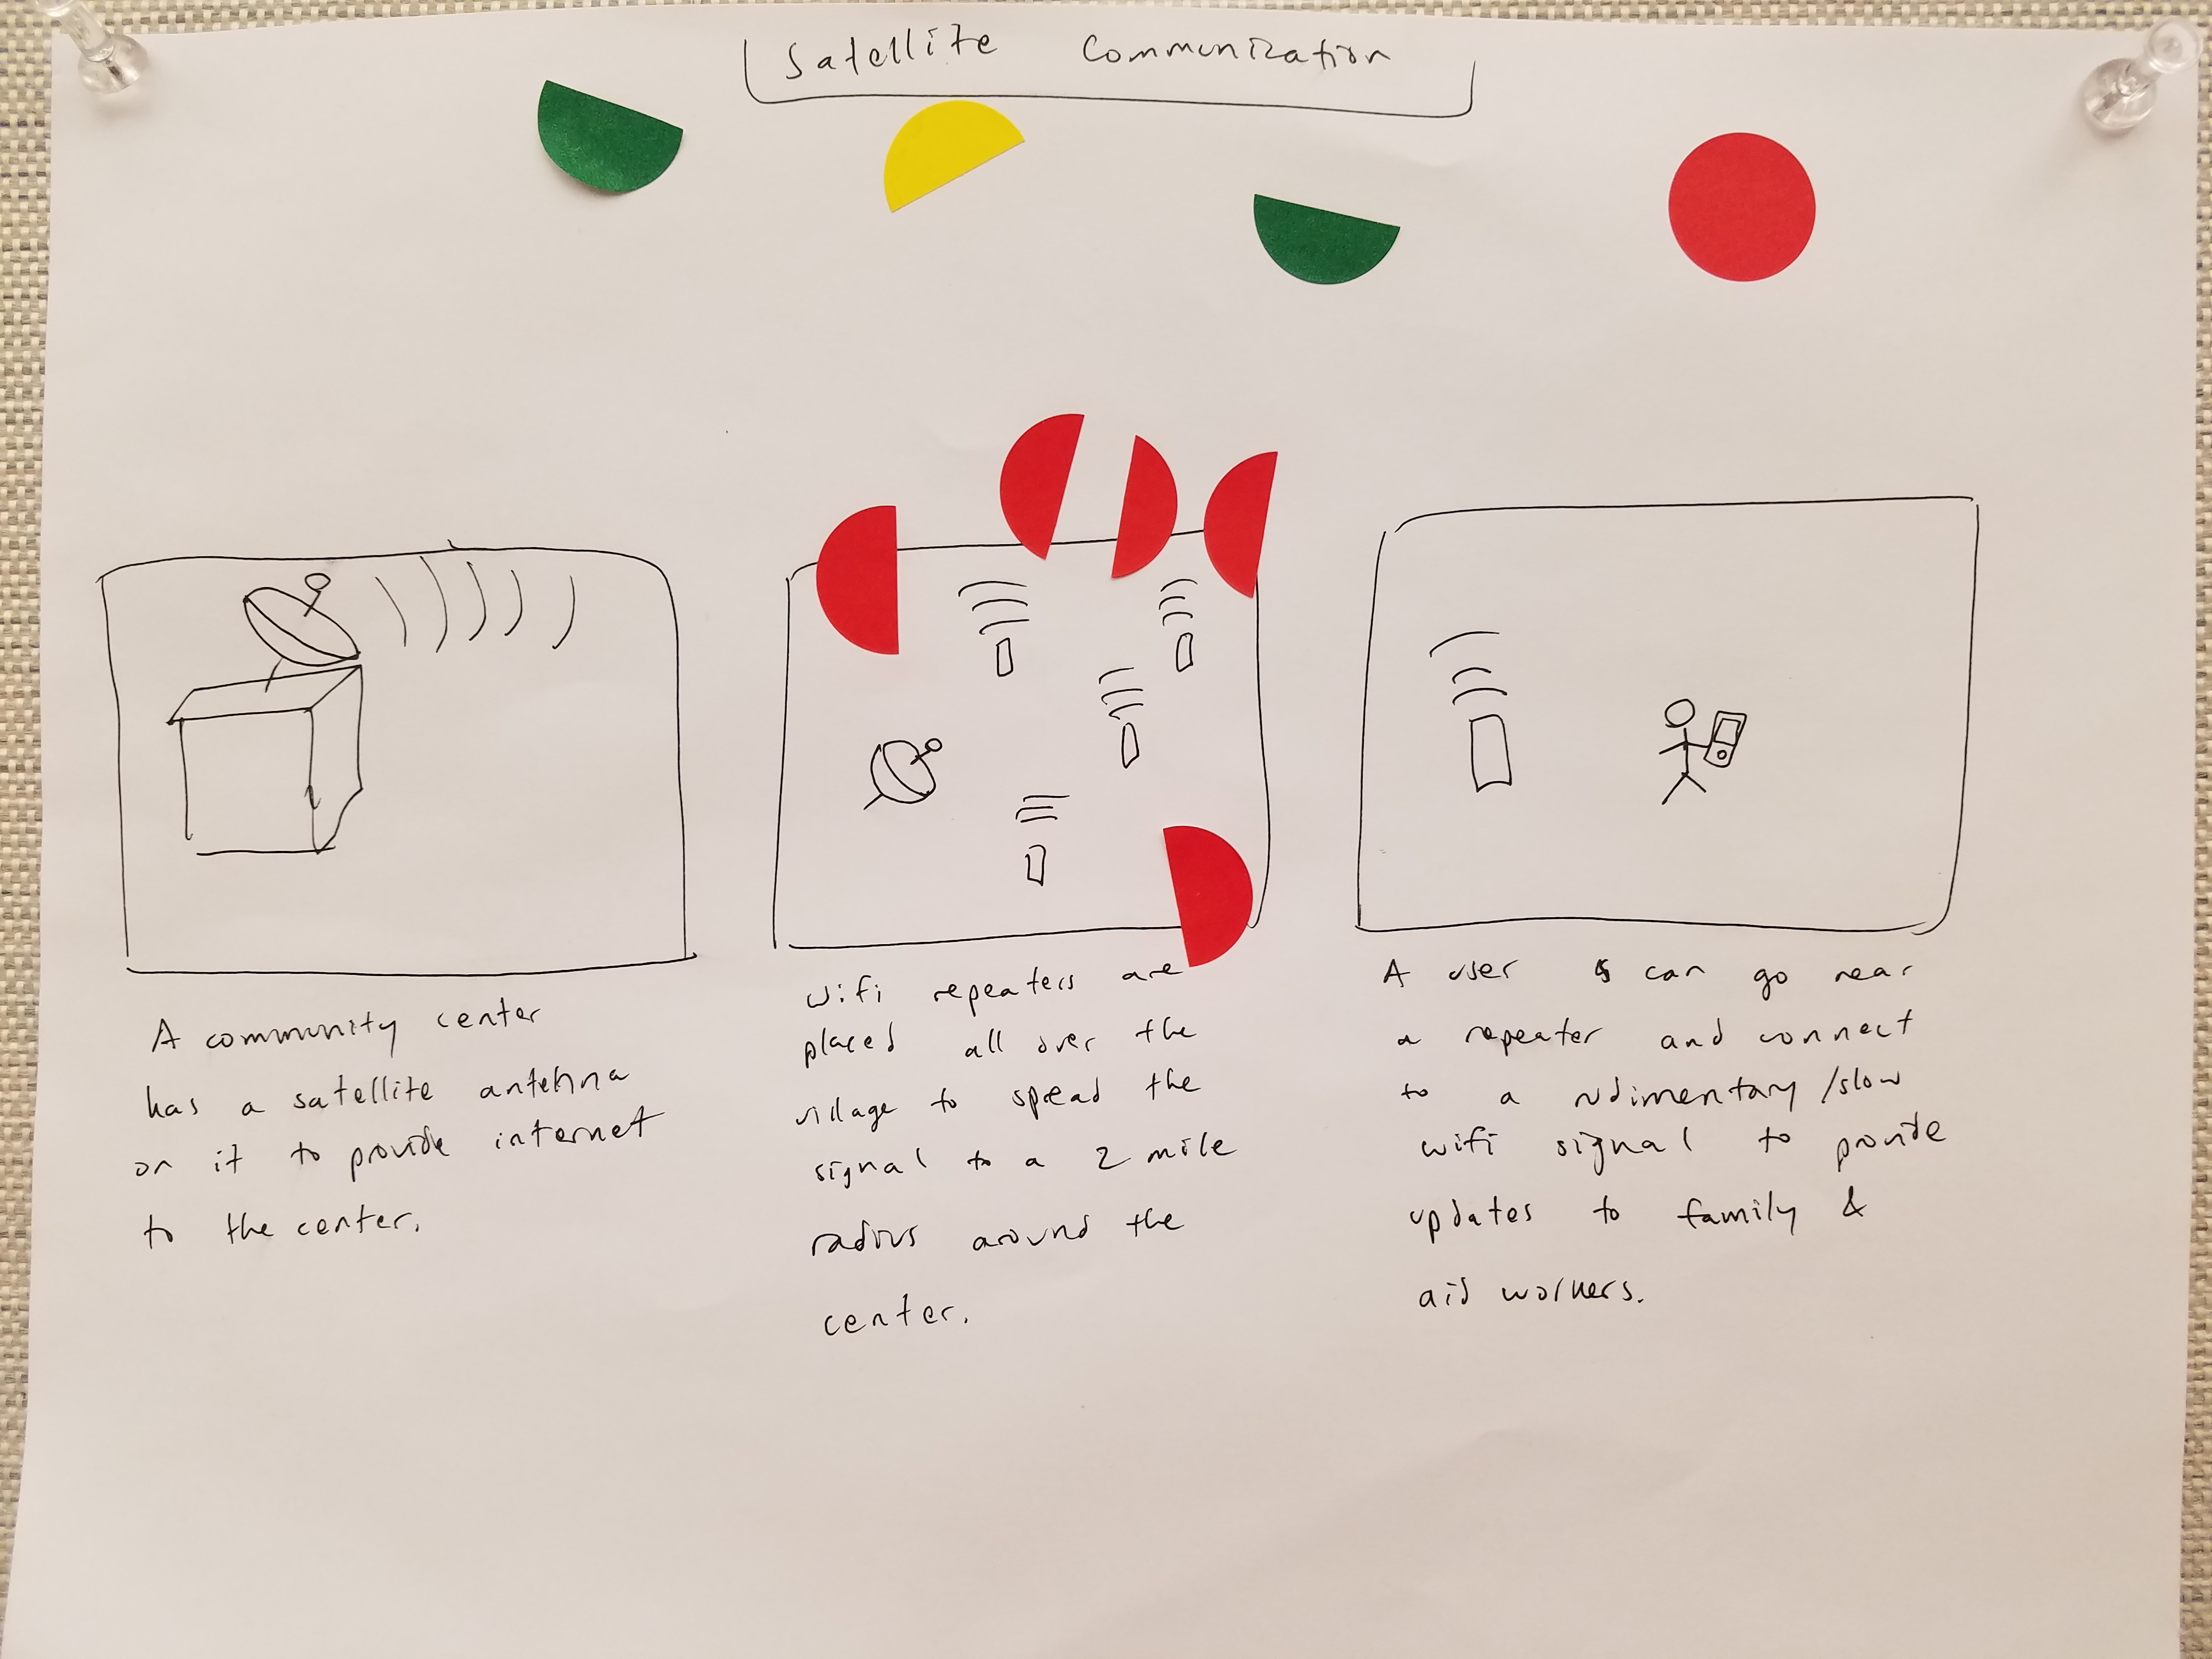
Satellite communication repeaters in town centers
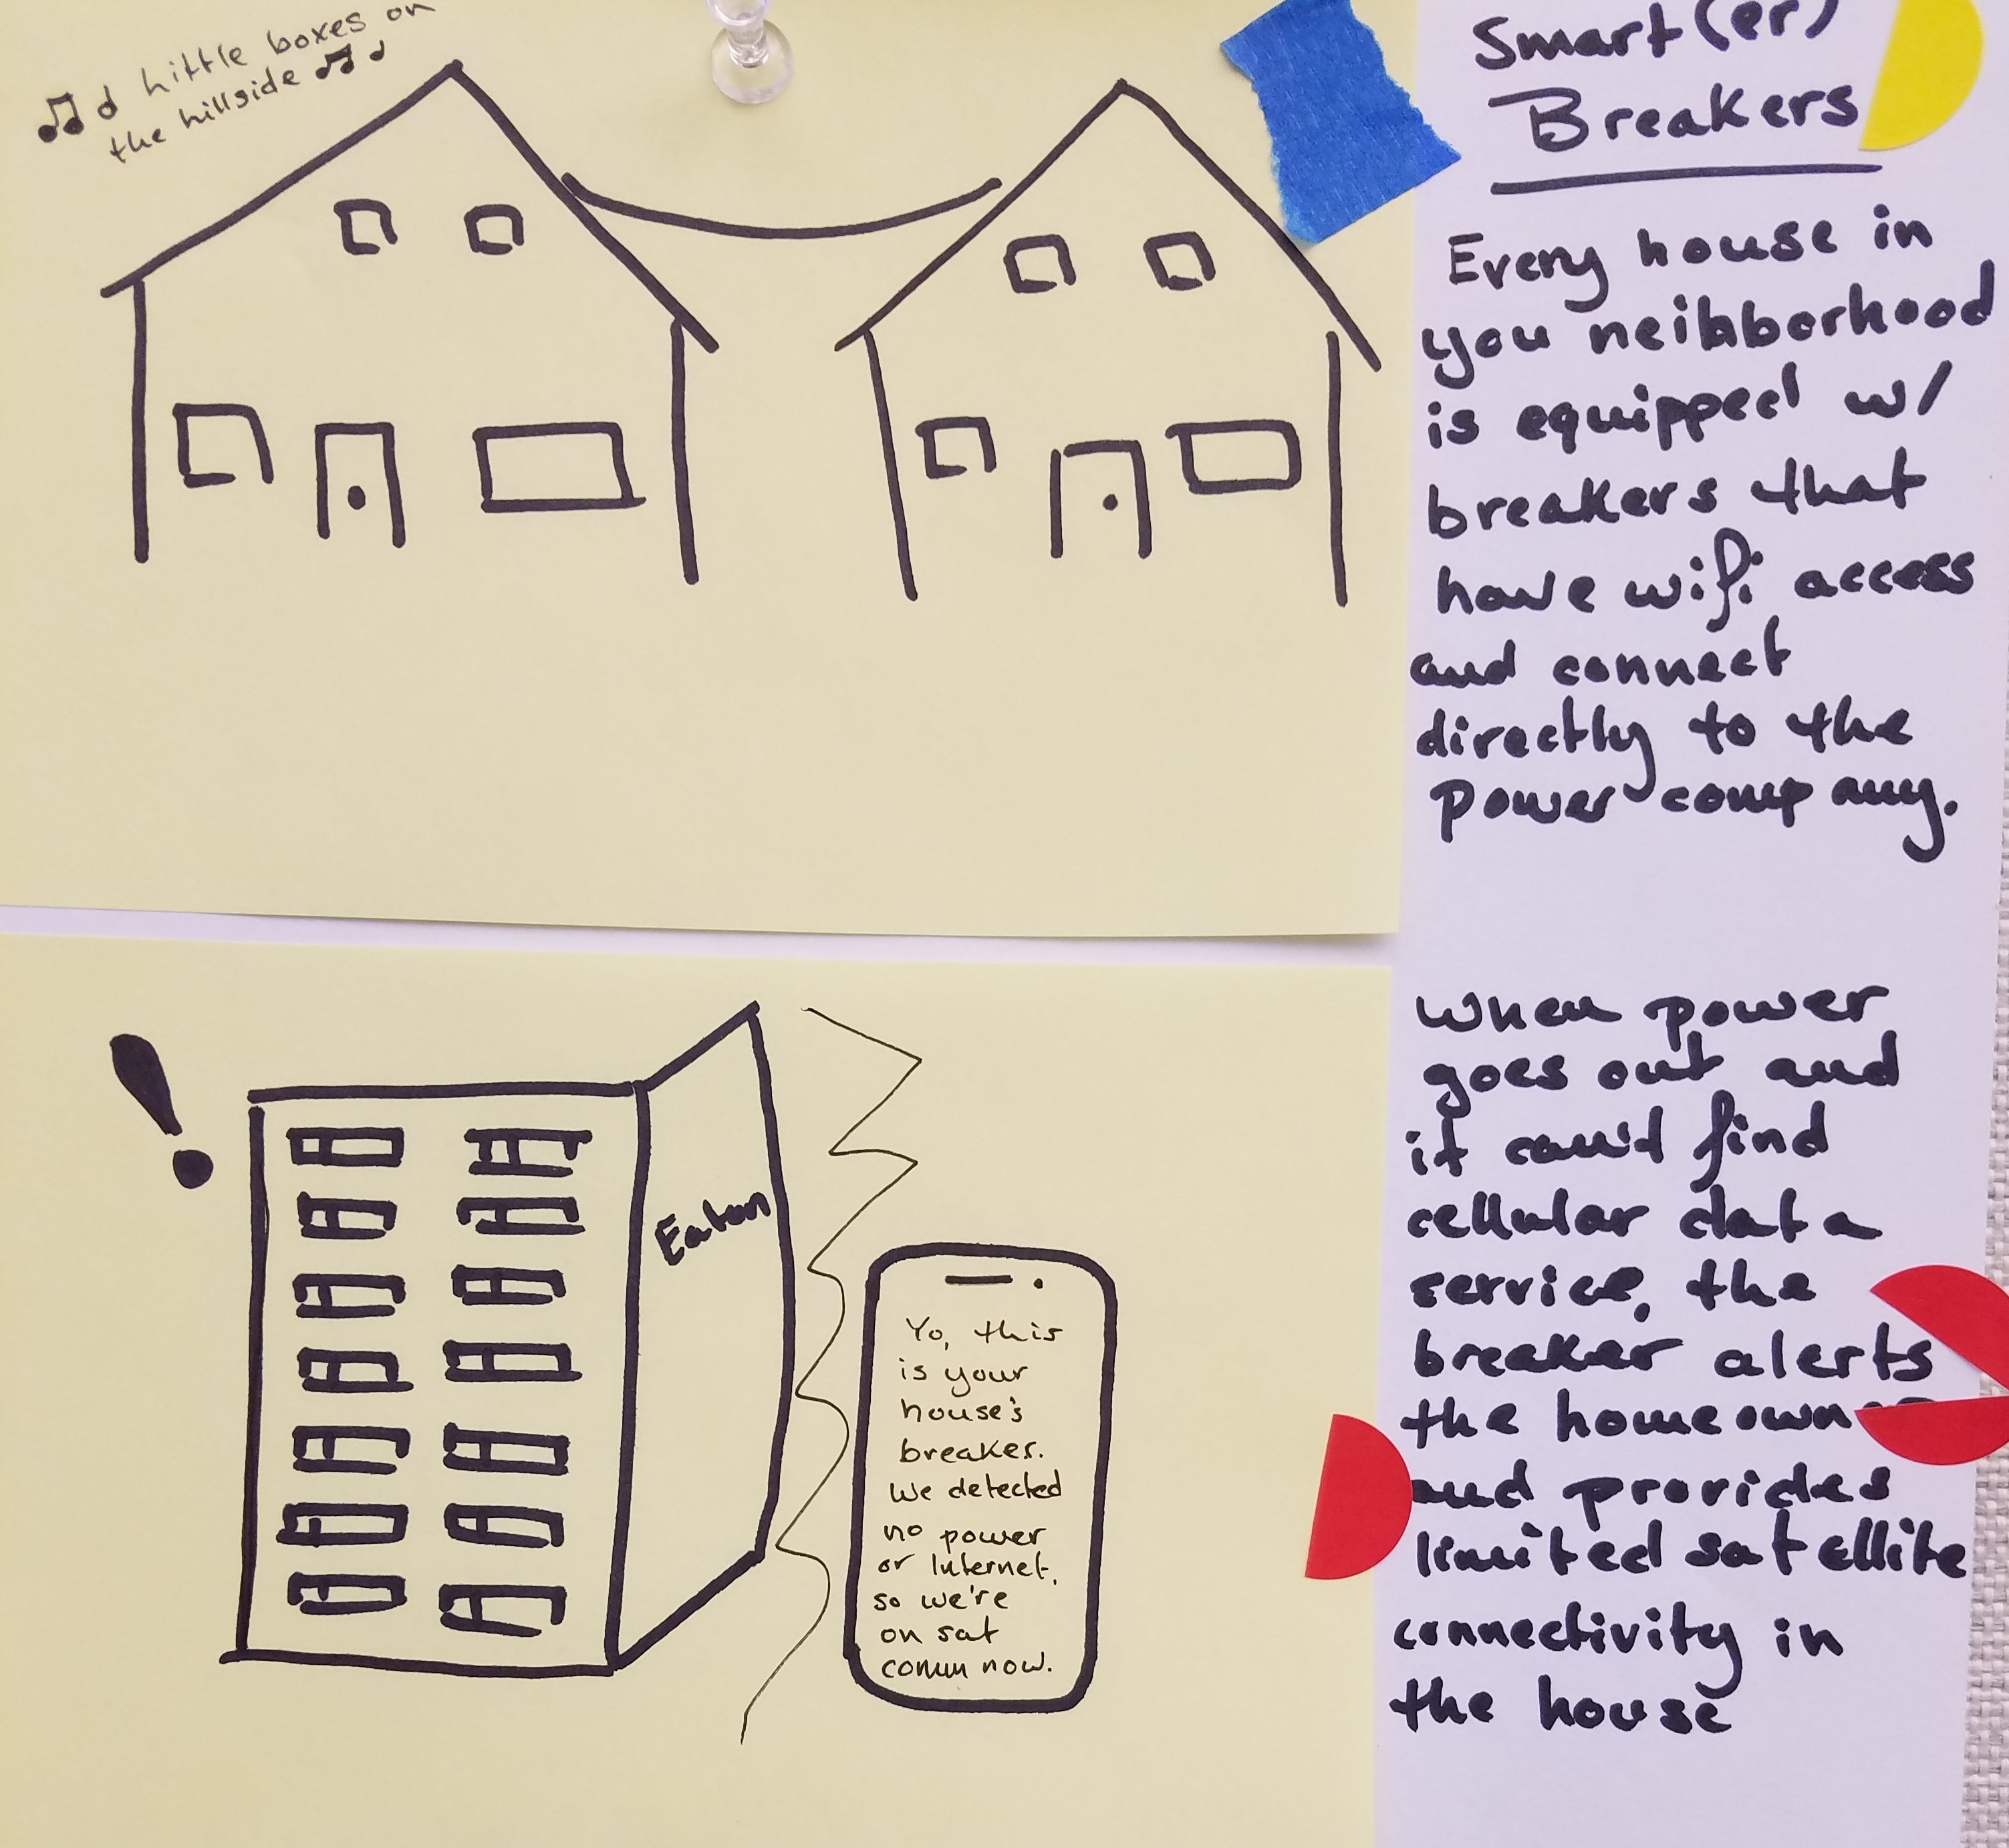
Smart breakers with satellite connectivity
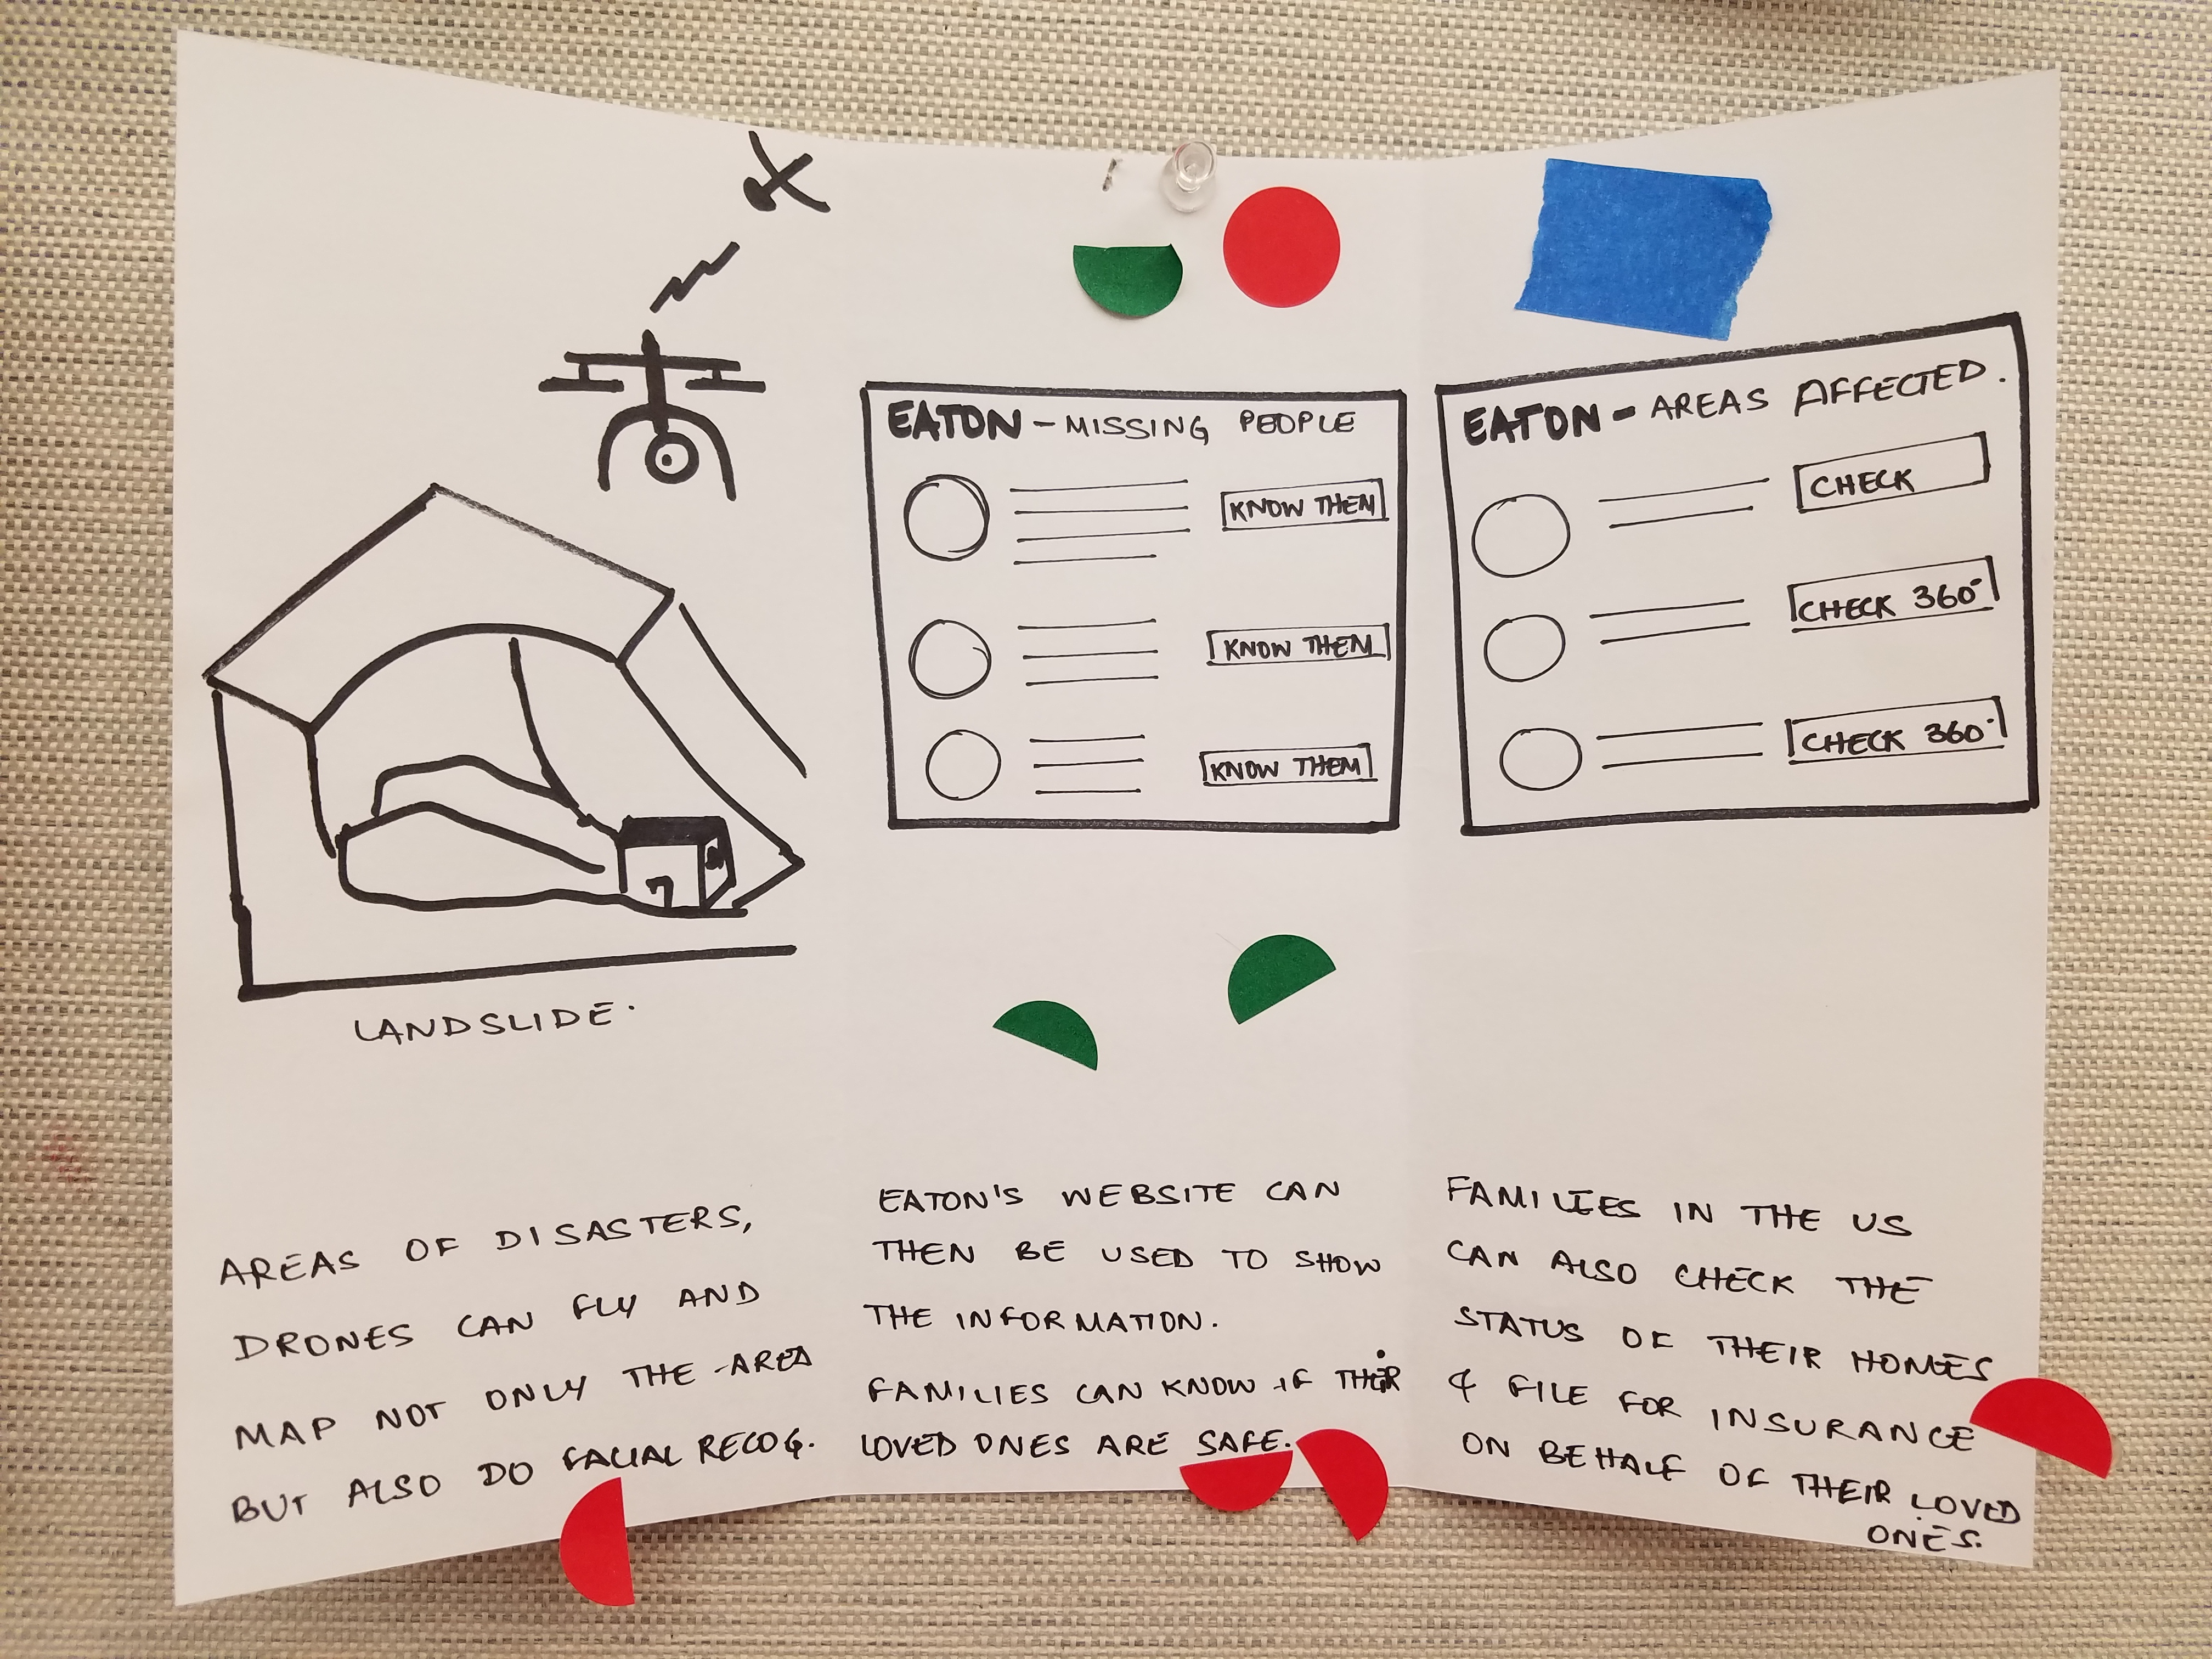
Drones with GIS mapping and facial scanning for survivors
Eaton-led initiative for employees to help local communities
Drone mapping of power outages and damage
Storyboards and Speed Dating
We created storyboards depicting each of our top ideas in a real-world disaster scenario. We "speed dated" each storyboard to the representatives from aid organizations, first responders, and disaster mitigation professionals that we interviewed, to get expert feedback for each scenario. While user testing our scenarios, we began the technical feasibility of each idea, including the use of drones in dangerous situations, satellite technology, and information management during a disaster.
Below is an example of a storyboard used for speed dating:
Speed Dating Insights
Many of the products we explored--including smart circuit breakers and satellites--already exist, but are commercially unviable to be ubiquitous. In scenarios that involve the transfer of critical information, it is extremely important that the best entity own and receive that data so that it gets to the right parties after a disaster.
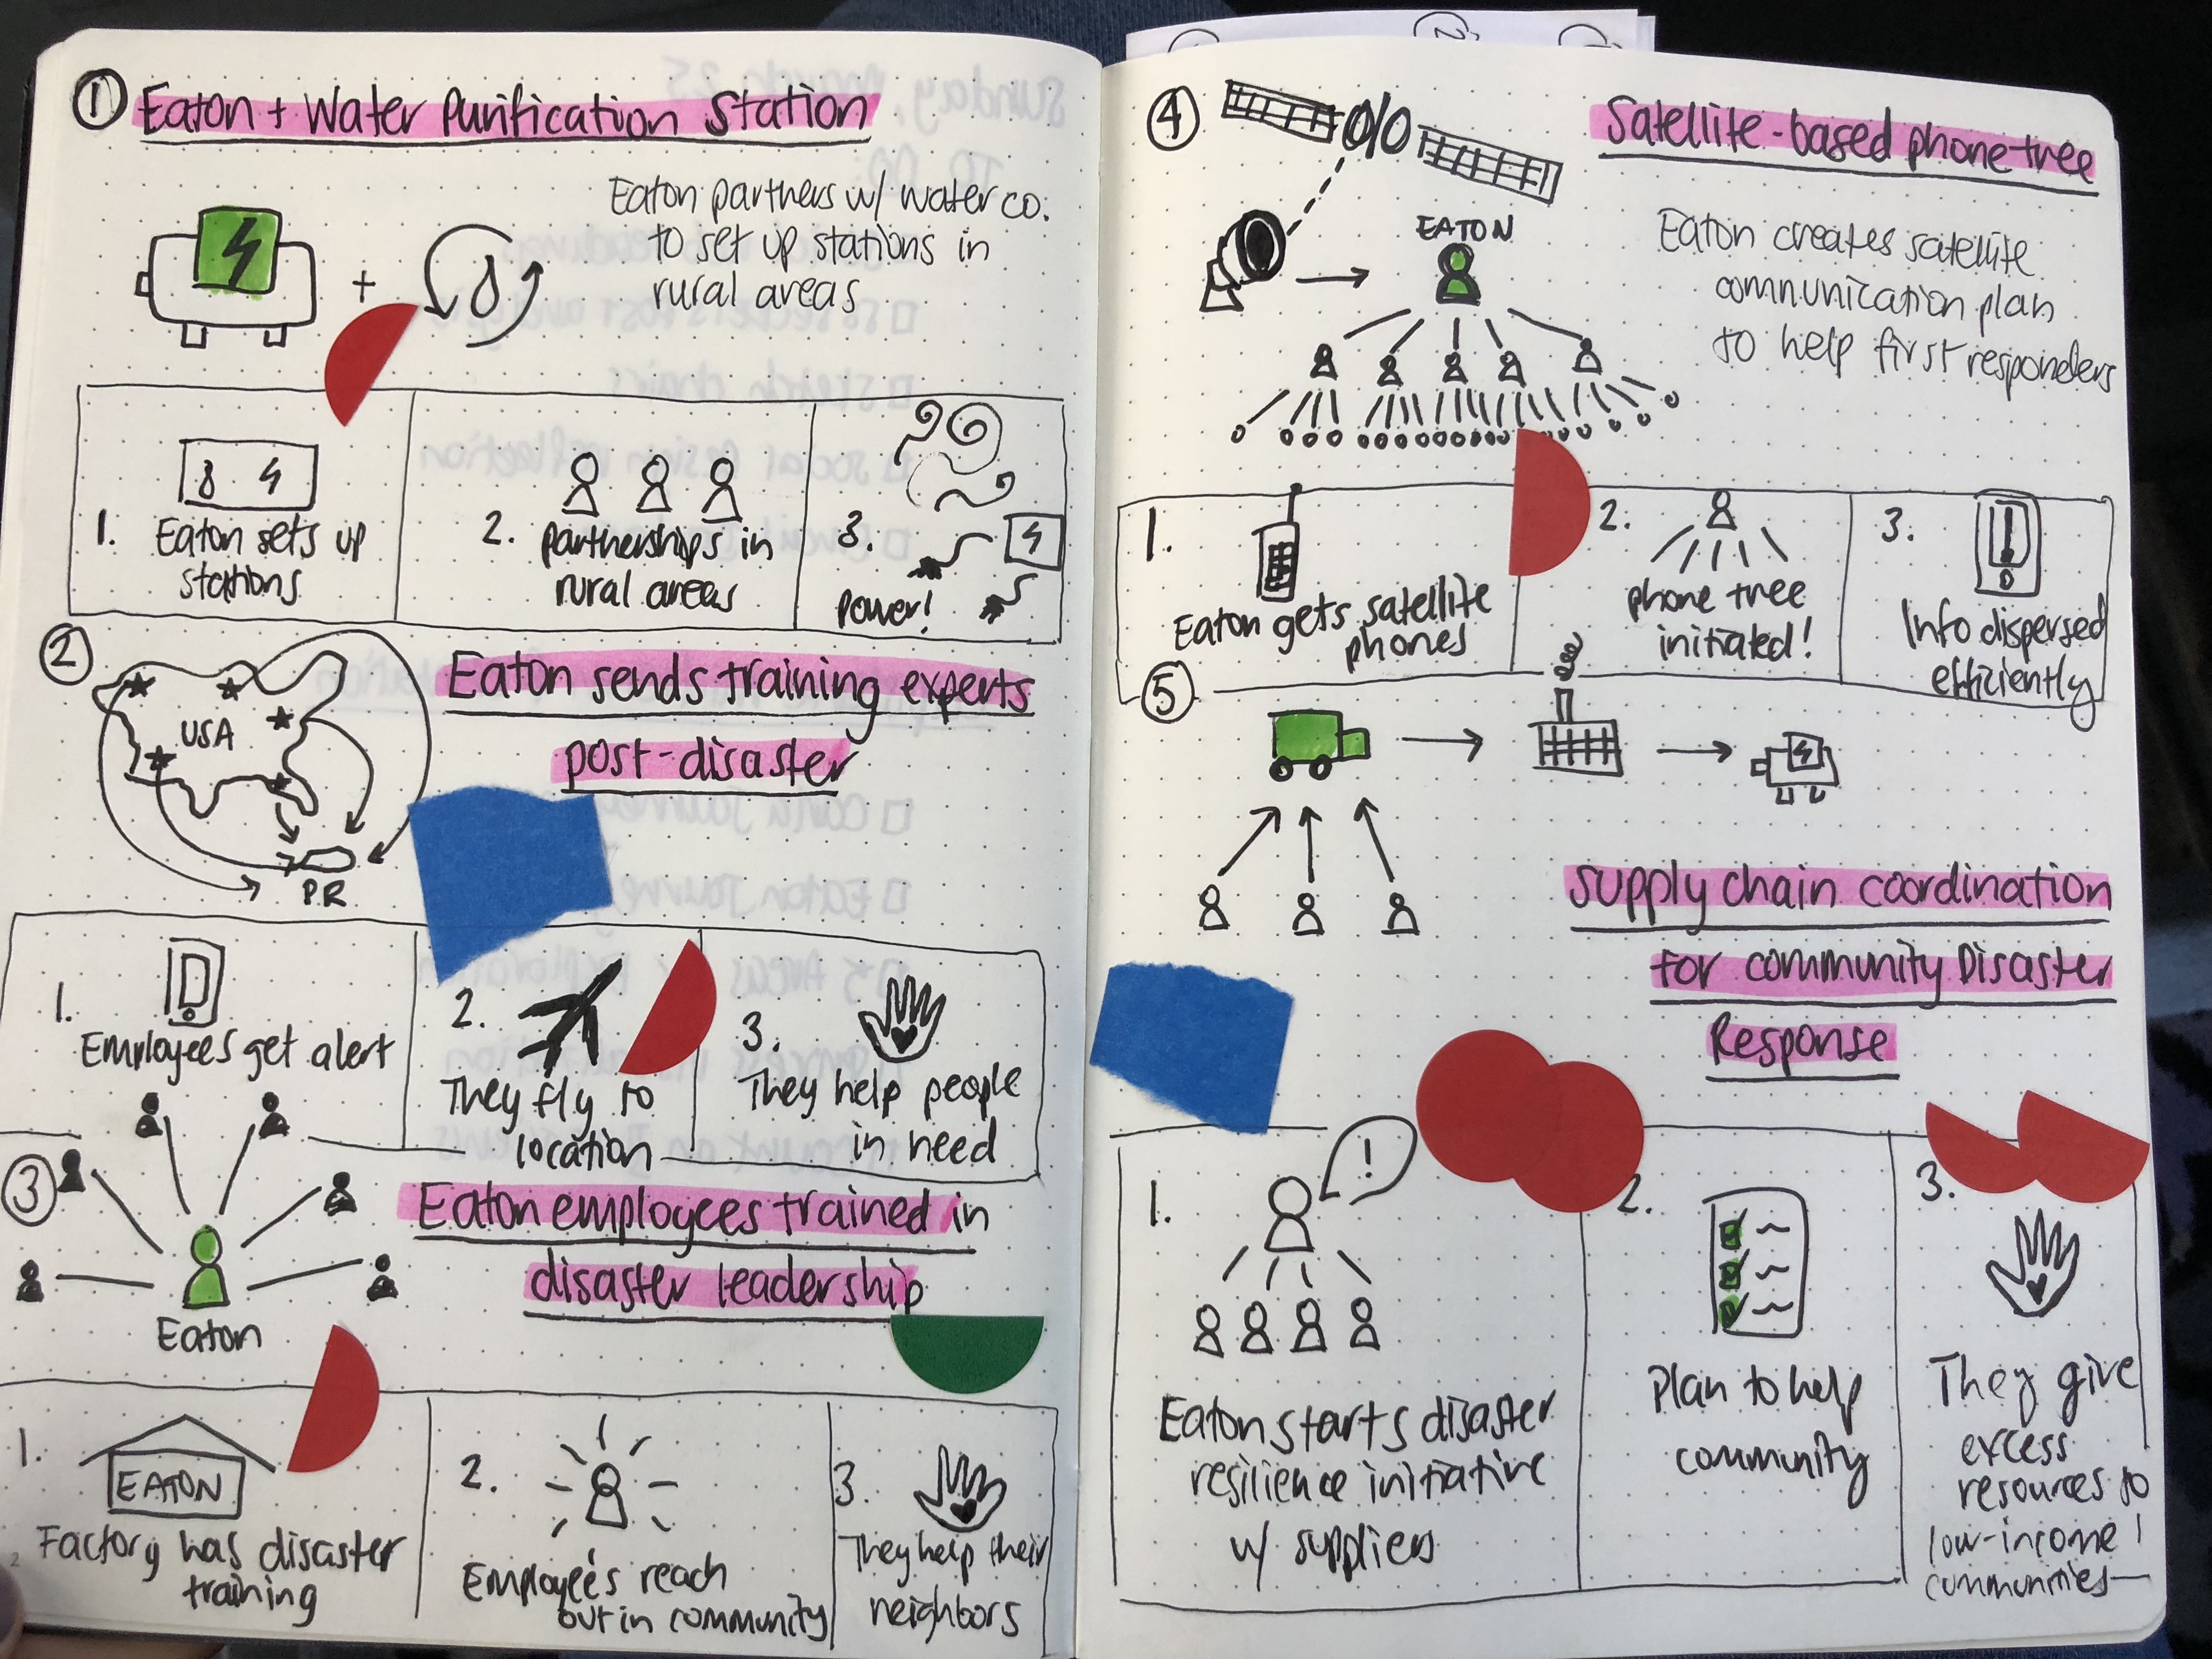
Codesign Session
We ran a codesign session with the Eaton design team, to co-create solutions for post-disaster communication. This combined our research knowledge with Eaton's extensive industry knowledge. We created 3D stories with figures and props (which can be found here) to embody real disaster environments.
In the midst of a serious design session, Cameron plays with a drone figure.
Final designs
At the end of the design phase, two strong designs were fleshed out and presented as the final output.
01. Connected Lights and Data Visualization
Design Synopsis:
Smart streetlights contain cellular-connected sensors. Sensors update the cloud with streetlight network health. In a disaster, some of the lights will be destroyed. This will reflect in network status visualizations when a node stops transmitting data. Data is then given to first responders to assess overall damage as needed. Often, there are not systems in place to collect information required to distribute resources.
02. Drone Mailman
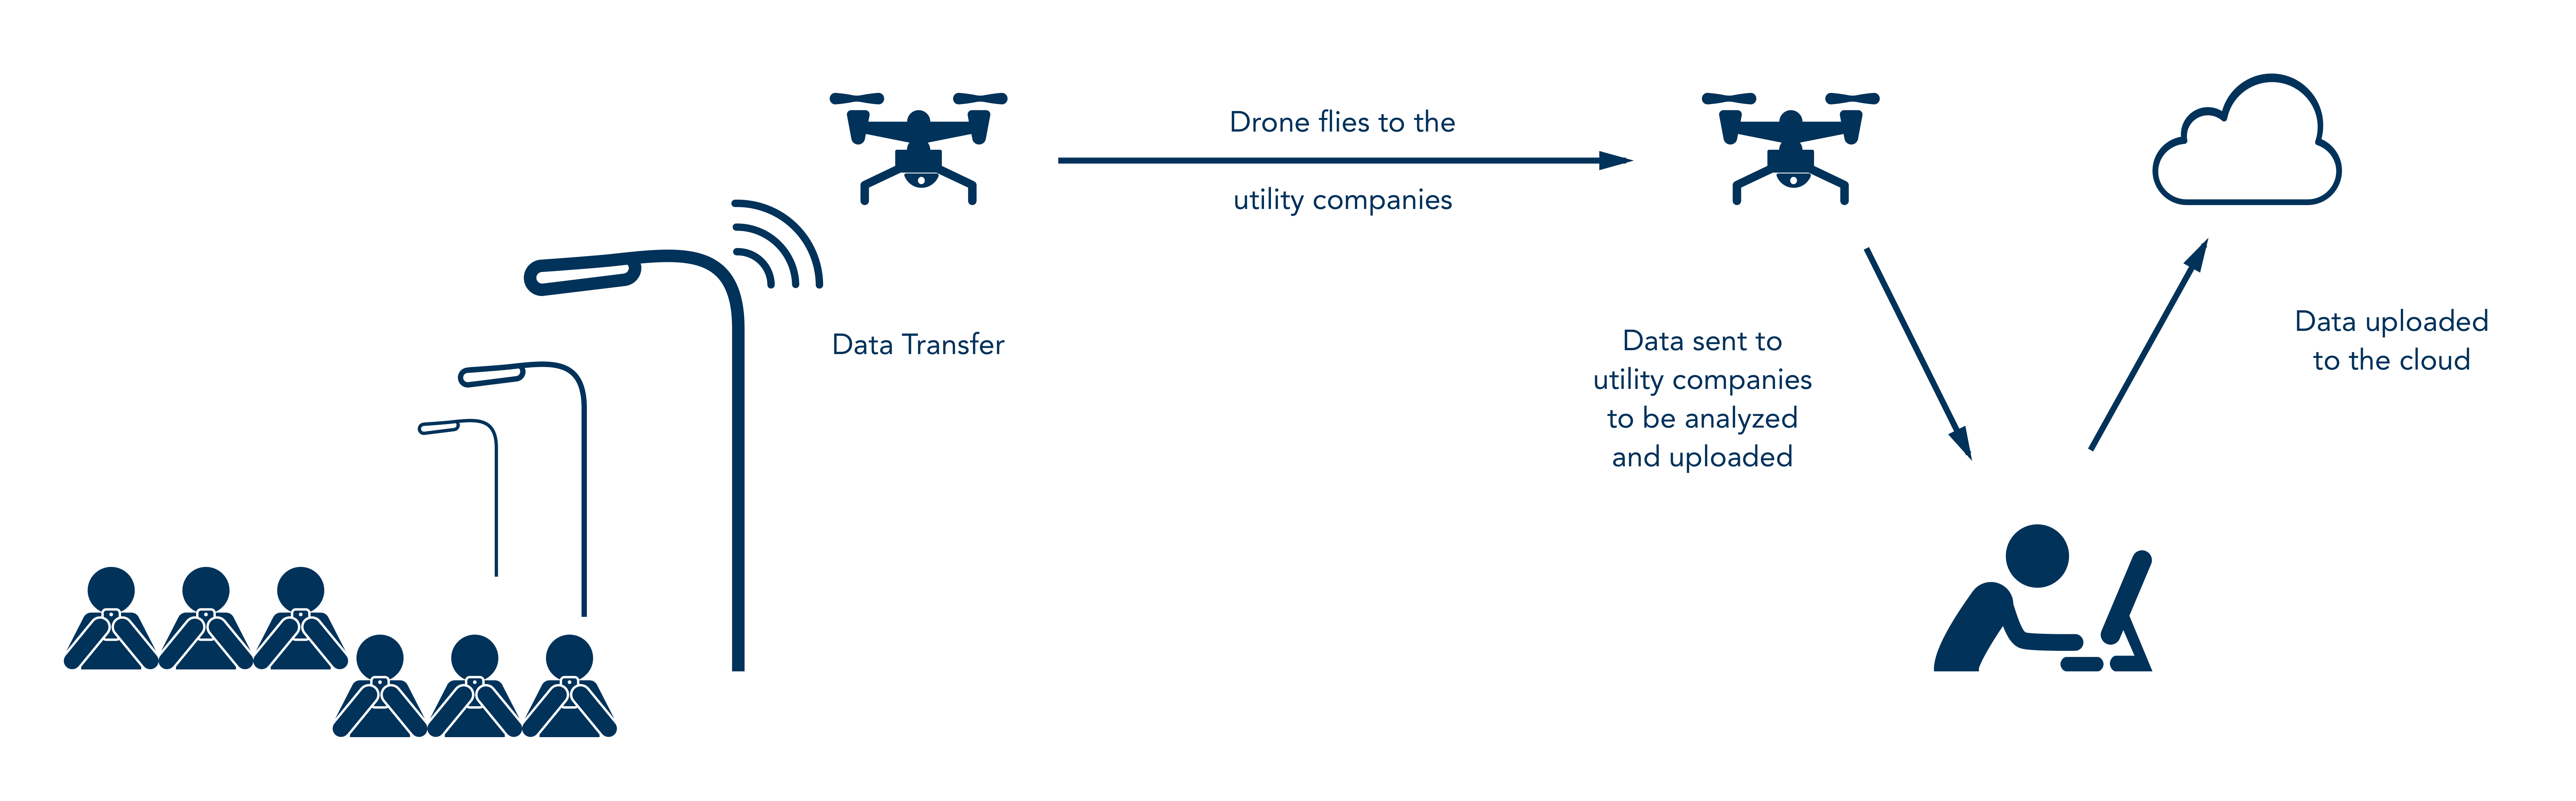
Design Synopsis:
Mesh-networked (LAN) connected street lights provide publicly accessible wifi. LAN remains accessible when Internet and power go out in a disaster. Connecting to wifi redirects to an emergency contact web application. Civilian responses are saved to a network database.
Drones with mesh-network modules can fly by and wirelessly download the databases. Affected civilian “mail” is then sent to first responders and other civilians.